The vast majority of scientists working in the field of climatology agree that the Earth's atmosphere is heating up and human activity is at least partially to claim. However, outside of the science of climatology this is still seen as controversial by many. The objections tend to take one of these forms:
- Type A: There is no evidence of global warming.
- Type B: If there is evidence of global warming, then it is not due to human activity.
- Type C: If global warming is occurring and it is due to human activity, then it is not going to be damaging.
- Type D: If global warming is occurring and it is due to human activity, and it is going to be damaging, then the costs of avoiding it are too high, so we should do nothing.
Today I'd like to talk about Type A - that global warming is not occurring, or that it has stopped. There have been numerous variations on the claim - the one that's currently making the round is that the British Met Office has allegedly conceded that global warming stopped 16 years ago, even though the Met Office has said no such thing. I've looked at a number of such claims, and one common trend I've noticed is a certain... willingness to play fast and loose with statistics.
The most blatant example I've come across was an article by one Christopher Monckton, who is fairly famous for his efforts in this field. The original article is no longer available, but fortunately a copy still exists at Archive.org. In this article, he used the following graph to prove that not only global warming had stopped, but that there is actually a cooling trend!

I was intrigued when I stumbled across this back in April 2008 and decided to replicate the graph. It turns out that he had used the HadCrut3 data set of global temperature data, and based on that data set I was able to come up with the following graph (made with GnuPlot):
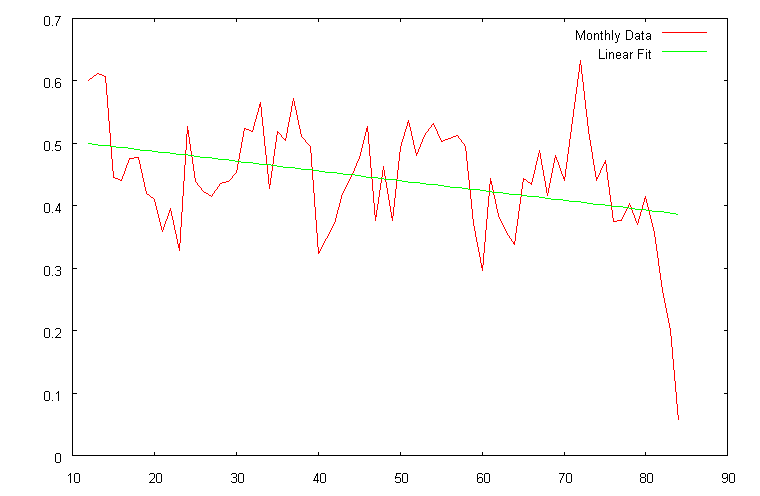
First of all, while the used data did show a cooling trend, my linear fit (again, done with GNUPlot) produced a cooling of
-0.00156427 °C/month.
Extrapolated for an entire decade, like the author has done, this would translate into:
-0.00156427*12*10 °C/decade = -0.1877124 °C/decade
This is not even half as much as the 0.4 °C/decade the author claimed. But wait, it gets better!
It seems that the author of the article, has deliberately started using the 2001-2008 HadCRUT3 data set with one of the hottest months in this period - which happens to be January 2002 (so he didn't use any 2001 data after all, despite the caption of the graph) - and then ended using the data with the very coldest month in this period, which was the abnormally cold January 2008:
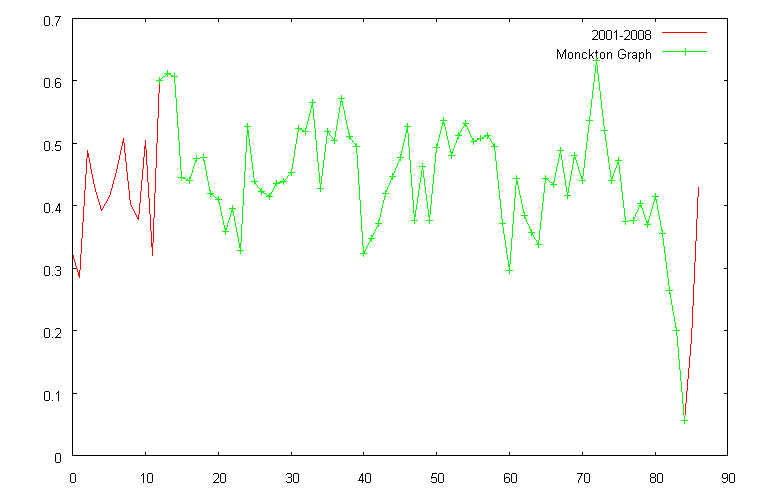
With such a self-selected data set to confirm his bias, is it any wonder that found got a significant cooling trend?
And why did he use only using only six years and one month to extrapolate a "cooling per decade" value - especially when the same data set goes back for far more than a decade and a real value could be easily calculated?
-0.00156427 °C/month.
Extrapolated for an entire decade, like the author has done, this would translate into:
-0.00156427*12*10 °C/decade = -0.1877124 °C/decade
This is not even half as much as the 0.4 °C/decade the author claimed. But wait, it gets better!
It seems that the author of the article, has deliberately started using the 2001-2008 HadCRUT3 data set with one of the hottest months in this period - which happens to be January 2002 (so he didn't use any 2001 data after all, despite the caption of the graph) - and then ended using the data with the very coldest month in this period, which was the abnormally cold January 2008:
With such a self-selected data set to confirm his bias, is it any wonder that found got a significant cooling trend?
And why did he use only using only six years and one month to extrapolate a "cooling per decade" value - especially when the same data set goes back for far more than a decade and a real value could be easily calculated?
The... kindest explanation I can come up with is that he has no working knowledge of statistics.
Of course, that was in 2008. So what is the current state of Earth's atmosphere? The recent graph by NASA might be illuminating:

There are plenty of graphs other than Monckton's in circulation that claim that global warming has stopped or is reversing itself - but as you can see here, the best that can be said is that the atmospheric temperatures are maintained at a very high plateau.
There's an excellent series by potholer54 on youtube on Lord Monckton, called "Monckton Bunkum". The first video handles this graph starting at 4:00: http://www.youtube.com/watch?v=fbW-aHvjOgM
ReplyDeleteHmmm, where do I fall. I believe deeply in climate change . . I have for 30 or more years. Cyclical climate has a long history and there's lots of data to support it. However, I question that humans are "causing" it . . since we are about where we should be in the cycle and we are not close to the highest temps of the last five cycles. Also, I question the hysteria about warming temps, as I feel that warmer temps will expand the areas where humans can live. I DO feel humans have a lot of negative impacts and would like to see us adapt our cities to address climate change and our burgeoning numbers . . . and heartily support the development of a treatment that will render young women sterile until they reach adulthood. I lean toward dense mega cities in the centers of continents, which would take humans out of the way of rising oceans (the ocean was 16 meters higher at one point and that would inundate most coastal cities), increasingly devastating to human cities hurricanes (evidence shows that most end of inter glacial periods were extremely erratic and I think worse storms are part of it) and most earthquake zones. If we started producing most of our food in vertical farms, we could ship less and that would help with CO2. I'd also have the cities designed to eliminate the need for personal cars, with free mass transit, and, in fact, make car ownership every expensive for any but those who needed to drive for their job.
ReplyDeleteI do not imagine that any of this will happen in the US in my life time. But I can dream.
Gwenny,
ReplyDeleteI have little doubt (always some!) that human activity is responsible. Based on natural forcing alone we should see a cooling trend.
Temperature is driven by a variety of sources, primarily solar irradiation, but also greenhouse gases, ozone, volcanic activity, sulphates etc. In the last 100 years greenhouse gases have been responsible for a temperature increase of 0.7 degrees, solar irradiation by 0.2, ozone by about 0.08, volcanics by -0.15 and sulphates by -0.25.
Those greenhouse gases are not due to additional natural emissions. Net natural emissions are 0% of the total; human emissions are 100% of the net amount released into the atmosphere (yes, natural processes actually absorb more than they emit). Further, despite a cooling effect of the Pacific Decadal climate pattern and a slight decrease in the last thirty years of solar irradiation, temperatures are still increasing.
c.f., Meehl, Washinton, Ammann, et al., Combinations of Natural and Anthropogenic Forcings in Twentieth-Century Climate, National Center for Atmospheric Research, 2004 and IPCC Climate Change 2007: Working Group I: The Physical Science Basis, Section 7.3
Also, in reference to the original post, an excellent article from New Scientist which explains that why Hadley data underestimates temperature:
http://www.newscientist.com/article/dn14527-climate-myths-global-warming-stopped-in-1998.html